------ DD OBJECTS ------
CORALL DISTRIBUTION FUNCTION
CRL OBJECTS
CORALL is the ion spectrometer with energy range 30eV - 25keV onboard INTERBALL/TAIL satellite.
It has a fan-shape aperture with polar angle range 30 deg - 150 deg divided into 5 channels.
Polar Channel 1 looks sunward, Channel 5 looks antisunward. Distribution function is calculated
from the full revolution data set using grid with dimensions, defined in resource files.
Grid is transferred from polar coordinates into Cartesian frame defined in resources files.
While the distribution function is projected onto the plane, there is actual averaging of values
along projection line.
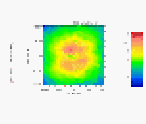
- CRLSLICE -The slice of distribution function along
the user defined plane inside user defined
boundaries, specified along perpendicular
axis. The file crlslicom.res controls this
object (see below ). You have to set up
Xrange and Yrange in request file.
- CRLDISSC-The bar of color coding of value of distribution
function for CRLSLICE object. This
object uses crlslicom.res ONLY to get
color scale.
This object
does not need Xrange and Yrange.
The projection plane, color scale of plotting and other
features of the CRLSLICE object are controlled by resource file 'crlslicom.res'..
CRLSLICE cuts the slice bounded by planes parallel YZ plane of reference frame. Then
remained distribution function projected onto YZ plane. Value at each YZ point is the integral
of distribution function along X axis divided by volume of accumulation.So the value is the averaged
value of distribution function at YZ inside slice.
To define reference frame one should put into
crlslicom.res file components of spacecraft axis in the new frame of reference EXACTLY at the time of
sunpulse. The time of sunpulse for this spacecraft spin is printed at the top of object plot.
To get spacecraft axis in the frame {Vconvective,B}
you can use program GetVBKP. See the detail description in section
"Other executables in DD system".
Example
"request.list":
002
CRLSLICE 0.2 0.350 0.764 0.8 -1000.0 1000.0 -1000.0 1000.0
CRLDISSC 0.9 0.350 1.0 0.764 0.0 0.0 0.0 0.0
1996:111:04:19:00
000:00:01:00
"crlslicom.res":
0.900 0.371 -0.201 0.026 0.425 0.904 0.421 -0.825 0.376 # Plane
-300. 300.                         # V limits km/sec
117.8                              # Revolution
1.e-31 1.e-23                      # Distribution Function Limits
30                                 # Grid size
0                                  # 0 --- to show blended pixels
                                   # 1 --- not to show
Output:
NOTE:
It is difficult to combine this type of object with
any object plotting data versus time because one could not set
in TimeInterval field the value larger than 110 sec. If the TimeInterval
is more than 2 minutes, DD_Request will overlap
next distribution function over previous one.
