The LLBL-DRIVEN SUBSTORM ?
Storm-Time Substorm Study
A. Fedorov, E. Budnick
Space Research Institute (IKI), Moscow, Russia
R. Lundin, I. Sandahl
Swedish Institute of Space Physics (IRF), Kiruna, Sweden
Contents
-
Storm overview. Measured and predicted Dst. Special substorm.
-
Substorm phases according to IMAGE data.
-
Solar wind parameters and dayside activity . Start of magnetospheric compression
at 21:30.
-
Full data set. The location of spacecrafts and IMAGE stations.
-
LANL data. Inflation. Expansion. Injection.
-
INTERBALL-Tail data. Spectrograms and parameters. Surge propagation along
magnetopause and LLBL.
-
Geotail data. Recovery phase after surge propagation.
-
INTERBALL-Auroral data. Three regions corresponding to 3 phases of the
substorm.
-
Scenario. Timing Graph.
-
Conclusions.
- Additional study
- Acknowledgements
Storm Overview
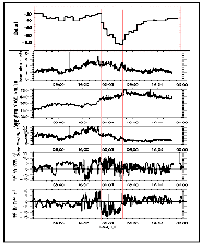
Fig. 1 shows the storm overview. The storm is
caused by high amplitude (up to -10 nT) prolonged southward IMF. Such conditions
are produced by IMF compression in interplanetary interaction region between
high density - low speed and low density - high speed streams in SW.
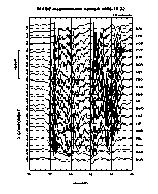
Fig. 2 (IMAGE magnetometer data) shows the
set of substorms during the storm main phase. The most pronounced substorm
onsets are at 22:22 and 02:15.
|
Fig. 1. SW parameters and DST
profile |
|
|
| Fig. 2. IMAGE data set. |
|
According to equation
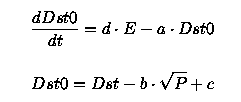 from paper Burton et al., 1975 the DST0 gradient is well enough
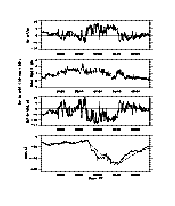
predicted by value of IMF Ey. See Fig. 3.
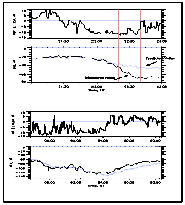
The main difference between measured and predicted Dst0 values is during
time interval 22:20 --- 22:35 UT. (Fig. 4 ,
upper panel) It means that the first substorm gives an additional contribution
to ring current. The rest of the time ring current increasing can be explained
by direct-driven processes. We consider further this first special substorm only.
|
Fig. 3. Predicted and measured Dst0
profile and corresponding SW parameters.
|
|
|
Fig.4. Dst profiles calculated with
different initial values of Dst0.
|
|
Substorm phases according to ground-based magnetograms
|
Fig. 5. IMAGE
network magnetograms.
|
|
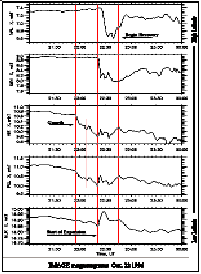
Fig. 5. shows magnetograms from several IMAGE stations
located at about midnight meridian for the period of interest. There is
strong substorm at 21:55 - 23:00 and then the high magnetospheric activity
with the set of small substorms. This substorm is the first occurred after
IMF turned southward. Before there was prolonged northward IMF.
Substorm phases:
-
21:55 - start of strong convection --- growth phase. Increasing of westward
current at low latitudes.
-
22:08 - small onset (not important)
-
22:22 - start of rapid poleward expansion (main onset of substorm). The
westward current increases (the current wedge), and shifts to high latitudes.
-
22:45 - start of recovery phase.
-
23:00 - end of the recovery, but on the background of the disturbed conditions.
|
Solar wind parameters and dayside activity.
-
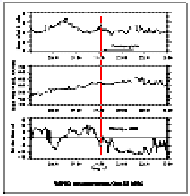
Fig.6 shows solar wind parameters obtained by WIND
and shifted by 1300 sec (time of solar wind propagation from WIND to subsolar
magnetopause).
-
WIND is far from the Earth (X=112 Re Y=-66 Re) so we use CANOPUS data to
check time lag and to get a proof that the disturbance of the LLBL and
whole magnetosphere occurred due to IMF turning.
(see Fig.7 )
-
There is small peak of ram pressure at 21:35 UT. Probably it is stronger
near the Earth (bad correlation WIND - Earth). But compression of magnetosphere
happens even in case of southward turning of IMF only so this item is not
so important.
|
Fig. 6. WIND: IMF Bz,
SW velocity and ram pressure
|
|

|
Fig. 7. The CANOPUS data and
corresponding IMF Bz profile
|
|
-
Fig.7 shows the CANOPUS magnetometers profiles,
the location of 3 Canopus stations (on the ionospheric precipitation map
after Newell and Meng, 1994) and IMF Bz profile.
-
There are 2 short southward turning of IMF at 20:30 and at 21:30. They
coincide with positive spikes in magnetograms exactly at the same time.
It means the time lag was chosen correctly. CONT is in the cusp projection
and feels the begin of reconnection at subsolar point better than other
stations. RANK, which is in LLBL, as well as CONT show the increasing of
westward ionospheric current while IMF Bz is negative. The depression of
magnetic field saturates when IMF Bz becomes close to zero. DAWS projected
onto CPS shows the recovery of the CPS at 22:40 UT.
-
The peak of increasing of the ground field means compression of magnetosphere
due to southward IMF and (possibly) pressure pulse.
-
At 21:30 UT the BIG disturbance (wave of compression) starts to propagate through
LLBL from dayside point downtail. Due to increasing the FAC, and then cross-tail
current, magnetosphere begins to compress.
Full Data Set. Location of Spacecrafts.
|
Fig. 8. The location of satellites
at 22:00 UT. The IMAGE
network and AURORAL are
shown at ionospheric
projection.
|
|
-
The list of data used in this study:
-
IMAGE magnetometers data
-
LANL-80,84,95 geosynchronous satellites data (electron flux in energy range
50 - 75 keV).
-
INTERBALL-TAIL plasma and magnetometer data
-
INTERBALL-AURORAL plasma and magnetometer data
-
GEOTAIL plasma and magnetometer data
-
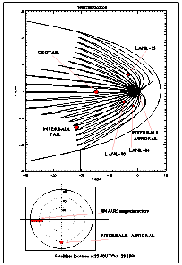
Fig.8 shows the location of spacecrafts for 22:00
UT in the X-Y (GSM) projection. All spacecrafts are near the plane Zgsm
= 0. Magnetopause position was calculated according to Shue model (1997)
with SW parameters - P = 4nPa, Bz = -10nT. Field lines correspond to Tsyganenko96
model for the moment 22:00 UT. Field lines drawn pass through the points
with coordinates X=Xgsm_Interball-Tail, Z=Zgsm_Interball-Tail, Y varies
from -22Re to 22Re. The location of INTERBALL-AURORAL and IMAGE network
is shown at additional frame. INTERBALL-AURORAL is on the field lines,
projected to the flank of magnetosphere at terminator. See Fig.17.
|
We investigate the data from spacecrafts in order corresponding to increasing
the distance from the subsolar point of magnetopause to satellite. We take
into account only significant events. For instance: substorm onset registered by
IMAGE at 22:22.
LANL Data
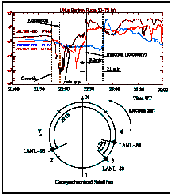
Fig.9. shows electron fluxes in the energy range
50 - 75 keV obtained by LANL-80,84,95. The brown curve corresponds to LANL-80,
which was located closer to the midnight than other LANL satellites.
|
Fig. 9. LANL-80,LANL-84 and
LANL-95 electron flux data.
|
|
-
We distinguish three phases according to LANL-80 data:
-
Start of inner magnetosphere inflation at 21:47. It means the increasing
of cross-tail current at the inner boundary of PS, stretching of field
lines tailward and increasing of the volume of inner magnetosphere. This
leads to adiabatic cooling of electrons and decreasing of particle density.
21:47 is labeled as the begin
of growth phase for this region.
-
Begin of the expansion - 21:57 (minimum of electron flux and start of increasing).
The cross-tail current and the volume of magnetosphere begin to decrease
(dipolarization).
-
Strong injection at 22:25. We associated this event with dipolarization
and recovery phase of substorm.
-
Different LANLs registered injection at different times. The explanation
is shown at low panel of Fig.9. The distance between LANL-84 and LANL-80
for electrons drifting around the Earth is 20 times less, than distance
LANL-95 - LANL-80. The corresponding time lags have the same ratio.
|
INTERBALL-TAIL Data
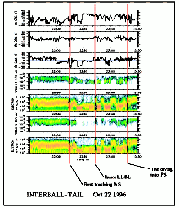
INTERBALL-Tail data is shown at Fig.10. Spectrograms
represent 2 angular channels of CORALL (ion spectrometer) and ELECTRON,
looking sunward (2 upper panels) and tailward.
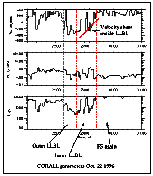
Plasma parameters (obtained from CORALL experiment) are shown at Fig.11.
|
|
Fig.10. INTERBALL-TAIL measurements
|
|
|
|
Fig.11. CORALL parameters
|
|
-
INTERBALL-TAIL enters MS twice at 22:15 UT and at 22:23 UT. Then it is
crossing LLBL. 22:30 - 22:42 - outer LLBL with mostly magnetosheath-like
ions. 22:43 - 23:27 - inner LLBL with large contribution of PS ions.
-
PS before LLBL crossing is cold and dense (thin PS) and after crossing
becomes hot and low-dense. ( Fig.11. ).
-
The mark points are following:
-
First entering MS. Magnetosphere compression reaches INTERBALL : 22:15.
Here LLBL should be relatively thin and INTERBALL-TAIL finds itself in
the magnetosheath practically without LLBL crossing.
-
PS ions appears in LLBL at 22:42. INTERBALL penetrates deeper into inner
LLBL. The peak of disturbance passed ( see Fig.17.
) and continues its propagation further downtail. According Lundin
et al., 1991 the increasing FAC from this region into ionosphere looks
like expansion (poleward shift of the position of westward current).
-
PS again (Recovery) at 23:28
|
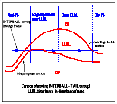
Fig.12. Cartoon of
INTERBALL-TAIL MP
and LLBL crossing
|
|
Note the clear velocity shear in the inner LLBL. Due to small plasma velocity
at the inner boundary of LLBL, the foothold at this boundary can move much
slower than magnetopause disturbance. This explains the long duration of
LLBL. Fig.12.
shows the possible picture of INTERBALL-TAIL magnetopause and LLBL
crossing. This picture assumes LLBL surge propagation downtail during
strong changes of IMF Bz. LLBL in this case forms thick layer between two
waveforms (magnetopause and inner LLBL boundary) moving with different
velocities. This cavern in magnetosphere can be created due to the
Kelvin-Hemholtz instability and flank reconnections.
|
GEOTAIL Data
|
|
Fig.13. GEOTAIL data
|
|
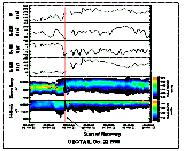
Fig. 13 shows GEOTAIL data (available from 22:30
UT). As well as INTERBALL-TAIL GEOTAIL observes firstly dense and cold
PS and about 23:00 the sharp increasing of Bz (dipolarization). Simultaneously
PS becomes hot and low dense. GEOTAIL sees nothing (no plasmoid, only thinning
of CPS) before dipolarization which we identify as recovery phase. In our
ideology it is the time of the end of surge propagation in this region.
|
INTERBALL-AURORAL data
-
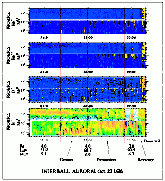
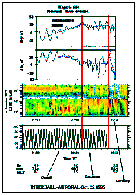
Fig. 14 and Fig. 15 show
the INTERBALL-AURORAL ion and magnetic field data. Panels from top to bottom
Fig. 14 show the following ion species:
He+, He++, O+, H+.
The Fig. 15 lowest panel presents
the pitch-angle the of PROMICS instrument and two top panels
show magnetic field (deviation from model field) is in MFL frame.
|
Fig.14. PROMICS-AURORAL
data
|
|
|
Fig.15. IMAP-3 and
PROMICS-AURORAL data
|
|
-
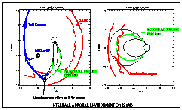
The location of INTERBALL-AURORAL for 22:00 in X-Y and Y-Z GSM and corresponding
(green) Tsyganenko96 field line are shown at Fig.
16 . This line passes not far from LLBL region at dawn terminator.
-
Before 21:40 hot PS ions and up- and downgoing low energy ionospheric ions
are observed. At 21:40 the intensity of ionospheric ions sharply increases.
But there is no significant flux of magnetosheath-origin ions except small
contribution of protons at 1keV energy. We interpretes this region as inner edge of
LLBL.
The satellite feels the southward IMF and increasing FAC. At this time
By increases and Bz decreases (see Fig. 15 )
It looks like field lines stretching. Simulatneously the intensity of PS
ions decreases. We are closer to magnetopause and probably the input of
high energy particles decreases as disturbance propagates further downtail
thinning PS.
-
Between 22:00UT and 22:10 the situation changes. The energy of oxygen and
He+ increases and He++ flux of high intensity shows that spacecraft is on the
projection
of outer part of LLBL. Accelerated ions of ionospheric origin and
magnetosheath-origin particles are observed simultaneously.
At 22:10 high energy ion population becomes highly structured. The low energy cutoff
is about 200 ev. The maximum of surge has passed. (Expansion phase for
this local point). There are accelerated ions injected from LLBL and strongly
accelerated ionospheric ions (O+ up to 20 keV). Magnetic field Fig.
15 has no trend, but is highly disturbed. We see injections from thick
and very disturbed LLBL.
-
At 22:25 the wave along LLBL has passed and the local recovery should start.
All plasma has been injected and nothing keeps the magnetosphere from collapse.
By and Bz decreases. There are intense injections mostly of magnetosheath ions.
(Accelerated O+ and H+ still exist).
Probably these injections are connected with propagation
of PC-5 pulsations.
|
Fig.16 Field line related
AURORAL satellite
|
|
All events at AURORAL and LANL-80 occur simulatneously. Fig.
16 explains the reason. The story starts when disturbance induces the
cross-tail current. At that time LANL and AURORAL feel the inflation of
magnetic field. The "expansion" and "recovery" should occur simultaneously
at both spacecrafts too.
|
Scenario. Timing Graph
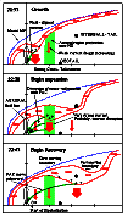
According to Lundin et al., 1991, Lundin et al., 1992 the following
scenario can be applied (see Fig.17. ) :
-
The compression due to southward IMF (and probably pressure pulse) propagates
tailward. Probably K-H instability and erosion of magnetopause due
to flank reconnections are the reasons of such a large disturbance.
There are two waves: along magnetopause and along inner edge of LLBL .
They have different velocities. LLBL becomes thicker dramatically and at
its inner boundary surge with large charge is created.
-
Deeper penetration of LLBL into magnetosphere creates local increasing
of cross-tail field in the tail and of FAC in the morning and evening sectors.
-
Surge reaches inner (near-Earth) boundary of PS. Cross-tail current increases.
LANL-80 and Auroral feel it simultaneously (Fig. 16
). Inflation of magnetosphere for LANL. FAC increasing for INTERBALL-
AURORAL.
-
Surge reaches auroral band (about X = -10Re) -- increasing FAC, thinning
PS, and in maximum, generates auroral events, probably current disruption.
Ionospheric conductivity increased due to injections and cross-tail current
diverses into ionosphere. The substorm current wedge is established.
-
Surge passes the auroral band and moves downtail.
The field-aligned current shifts to
higher latitudes . It looks like expansion. Very strong FAC at AURORAL.
Accelerated particles from LLBL and from ionosphere (O+ ions accelerated
up to 20 keV). Decreasing of cross-tail current near LANL-80 location and
resuming of the magnetosphere.
-
When main part of disturbance leaves this tail point (and the corresponding
latitude) the expansion begins. The main current moves poleward from this
point.
-
Surge passes INTERBALL-TAIL and it observes the LLBL and magnetopause.
At this time other measuring points show the end of the expansion. Geotail
is still in thin PS.
-
Set up of background-state situation. There are no currents to keep magnetosphere.
The recovery phase begins. INTERBALL-TAIL returns into PS. Geotail meets
large Bz and hot and low-dense PS. Sharp dipolarization at IMAGE. Injections
at LANL-80. Pulses like PC-5 and particle injections at AURORAL.
|
|
Fig.17. Cartoon of scenario.
|
|
|
|
Fig.18 Timing graph of "substorm phases"
|
|
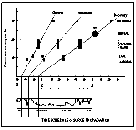
Time dependence for this scenario is shown on Fig.
18 . All events have different propagation velocity. Back interpolation
gives the correspondence of three main events to the changing of IMF sloop.
The "Growth" phase corresponds to the start of turning of IMF southward.
The "Expansion phase" corresponds to the minimum of Bz and short excursion
back, and the start of the "Recovery" corresponds to the saturation of IMF.
Different
velocities of propagation show that our assumption about different velocities
of different parts of disturbance is right.
Conclusions
-
The increasing of ring current intensity during storm is well enough described
by direct influence of SW conditions. The single exception occurred at the time of one substorm with
onset at 22:22. This first substorm gives a significant input into ring current.
-
All events of this substorm (especially behaviour of ions populations measured
by INTERBALL-TAIL, INTERBALL-AURORAL and GEOTAIL) show that substorm was
initiated by large disturbance moving along magnetopause.
-
There are many evidences that this substorm is LLBL-driven one. The sequence
of events corresponds to propagation of disturbance blob along LLBL.
-
Different parts of disturbance blob move with different velocities. This
leads to different speeds of propagation of substorm "phases" across the
points of measurements.
Additional Study
- Problems to clarify:
- How could such a big cavern in magnetosphere be created? Study of
the magnetopause - LLBL crossings of INTERBALL-TAIL probe.
- What part of LLBL or magnetosphere are projected onto
INTERBALL-AURORAL probe? How are INTERBALL-AURORAL
measurements connected with the processes it the vicinity of flank magnetopause?
- Understanding speed of tailward propagation of disturbance
(100 km/s - 50 km/s)
- Expected signatures at Geotail.
Relation between "Recovery" at Geotail and new substorm onset
at 22:56
- Study of possible time delays for each event due to finite Alfen speed.
- To Be Done
- Equivalent current system for different phases of substorm.
- Use all-sky camera to check our assumption about disturbance
propagation.
- To define the location of source of injection observed
by geosynchronized satellites.
- To define disturbance boundary velocities using
MAGION-INTERBALL-TAIL measurements
- To find and to study the similar cases.
ACKNOWLEDGEMENTS
We thank for providing data:
- WIND:
- K. Ogilvie - Solar Wind experiment, Key parameters
- R. Lepping - Magnetic Field Investigations, Key parameters
- GEOTAIL:
- T. Mukai - LEP
- S. Kokubun - Magnetic Field instrument
- INTERBALL-TAIL:
- J.-A. Sauvaud, N. Borodkova - ELECTRON
- S. Romanov - MIF
- M. Nozdrachev, S.Skalsky - FM-3
- Yu. Yermolaev - CORALL
- K.Kudela, V.Lutsenko - DOK-2
- INTERBALL-AURORAL:
- V.Styazhkin, V.Petrov, A.Bochev - IMAP-3
- J.-A.Sauvaud, R. Kovrazhkin - ION
- LANL:
- D.Belian, G.Reeves - Energetic Particles
IMAGE magnetometer data used were collected as a
German-Finnish-Norwegian-Polish project conducted by the Technical
University of Braunschweig .
CANOPUS network was supported by the Canadian Space Agency.
We are grateful to Dr. V. Sergeev for help in interpretation
of IMAGE data and for his outstanding remark: "I do not understand ..."
We thank Yu. Galperin, A. Petrukovich, L. Zelenyi,
E.Antonova, S.Savin,
R. Kovrazhkin,T.Bosinger, A. Jahnin, S. Perraut
for discussions.
We would like to emphasize that the main conductor of idea of LLBL-driven substorms
is S.P.Savin.
References
Burton, McPherron, Russel, An empirical relationship between interplanetary
conditions and Dst
J. Geophys. Res., 80, 4204, 1975
Lundin, R., I. Sandahl, J. Woch, R. Elphinstone, The contribution of
the boundary Layer EMF to Magnetospheric Substorms,
Magnetospheric
Substorms, Geoph.Monograph 64, 355, AGU 1991
Lundin, R., I. Sandahl, J. Woch, M. Yamamauchi, R. Elphinstone, J.S.
Murphree, Boundary Layer Driven Magnetospheric Substorms,
Substorms
1, ESA SP-335 193, 1992
Newell P.T. and C.-I. Meng, Ionospheric projections of magnetospheric
regions under low and high solar wind pressure conditions,
J. Geophys.
Res., 99, 273, 1994
Iijima and Poterma, Large-scale characteristics of FAC associated with
substorms.,
J. Geophys. Res., 83, 599, 1978
Lui, A.T.Y., Extended Consideration of a Synthesis Model for Magnetospheric
Substorms,
Magnetospheric Substorms, Geoph. Monograph 64, 43, AGU
1991
